
 Latest images


My answer:
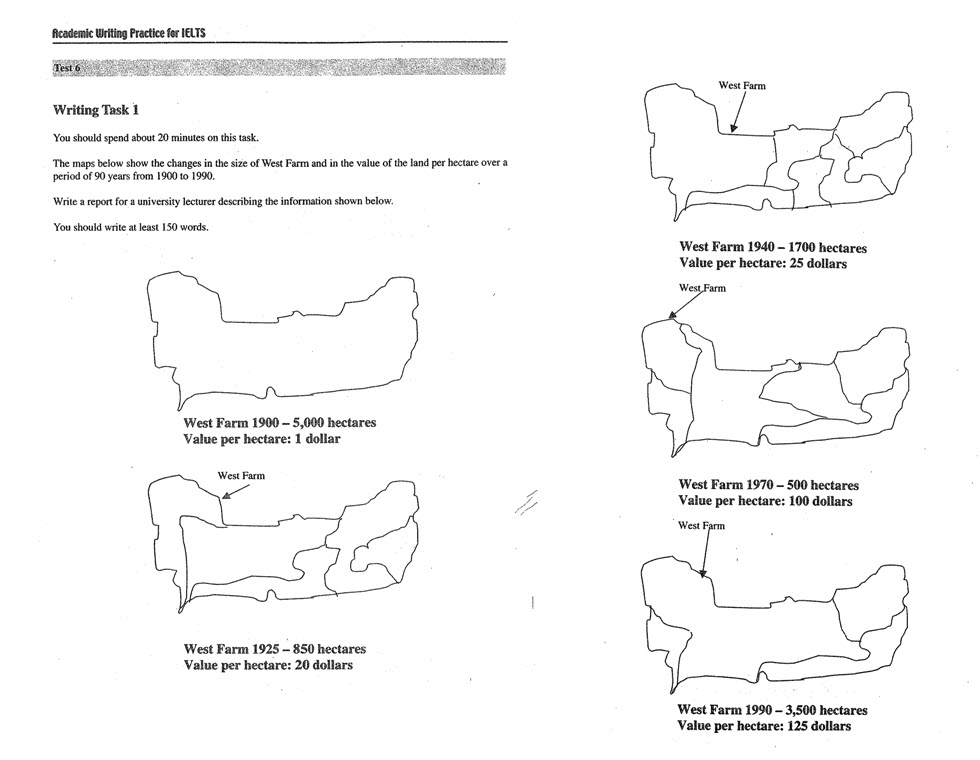
The maps present the changes in West Farm’s size and in the land’s value per hectare between 1900 and1990.
Over the period of 90 years, generally, the size witnessed a downward trend, climbing down from 5,000 hectares to 3,500 hectares, a contraction of over 30%. In contrast, the value of the land rocketed by 125%.
The land size plummeted dramatically, plunging 80% between 1990 and 1925 whilst the land was valued 20 times higher in the same period. 15 years later, there was a double increase in the land size, sharing the same upward direction with the land value, albeit at a slower rate of the latter.
In 1970, the size again sank significantly, reaching the lowest mark of 500 hectares, a triple decrease in comparison with the figure in 1940. The land value, on the other hand saw a dramatic surge of four-fold from 1940 to 1970.
West Farm’s size demonstrated a sudden turnaround by 1990 when the land size soared up by 700%, while there was only an increase of 25% in the land value, finishing the period at 125 dollars per hectare.
I will check out everyday to long for any comment, so please leave some here. Thank you so much!!!

Word count: 185

