
 Latest images


My answer:
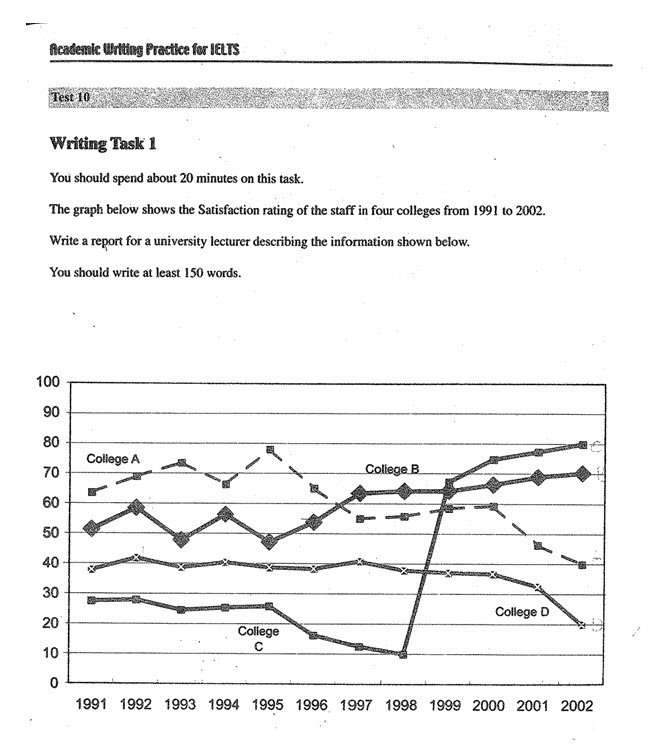
The graph shows the satisfaction levels which is rated by the staff in four colleges from 1991 to 2002.
College A and D experienced a downward trend over the period of 11 years, while there was an upward trend in the satisfaction rating of college B and C.
College A started the period with highest rating, standing at over 60%, nearly 3 times higher than the lowest rating which belonged to college C. Rating of college A hit its peak in 1995 with 79% then declined, hovering around the mark of 60% until 2000 and going down again for the last 2 years of the period. By contrast, college D’s satisfaction rating moved up and down around the level of 40%, indicating a long period of stability before climbing down to 20%.
After some fluctuations for the first 5 years, rating of college B witnessed a gradual growth to 70%, a rise of 20% in comparison with the beginning year of the period. College C held the lowest rating of under 30% at fist, and then followed by a gradual decrease until reaching its bottom of 10% in 1998. 1999 saw a sudden turnaround in the rating when it soared up by 7 times. Then there was a steady improvement until its rating topped the list of 4 colleges, finishing the period at exactly 80%.
Give me some comments, please. Thank you!!
Word count: 225